'They won't get stuck in the mud' - Three heavy ground horses to follow at Gowran
17 hours ago
We all have opinions on what is right and wrong with British horse racing. Is there too much horse racing? Are there too many odds on shots and small races? Thankfully, the BHA recently released its data for UK racing in 2016 which means we can answer some of these questions. We take a look at the data and break it down to find out what is really going on in British horse racing.
One of the areas British racing comes in for a lot of criticism in is the number of fixtures. Some argue that there is too much racing in the UK which causes smaller field sizes and less competitive racing.
The data in 2016 stayed much the same as it has in previous years. There were 1,434 fixtures in 2016 which remains virtually unchanged from the previous three years (1430, 1429 and 1440). All-Weather racing was the biggest beneficiary with an additional ten meetings in 2016 whilst both flat turf and jumps lost eight fixtures each.
Attendances at British racecourses in 2016 remained largely consistent with previous years. Flat turf fixtures recorded the highest mean average attendance at 6,044 whilst AW racing recorded the lowest at 1,144 in 2016. This was up from 1,048 in 2015 and a big rise on 2014 which record a mean attendance of 888, not surprising given the time of year. Jumps racing recorded a strong attendance again coming in at 4,082. Attendances have stayed largely resilient since 2012 across all codes.
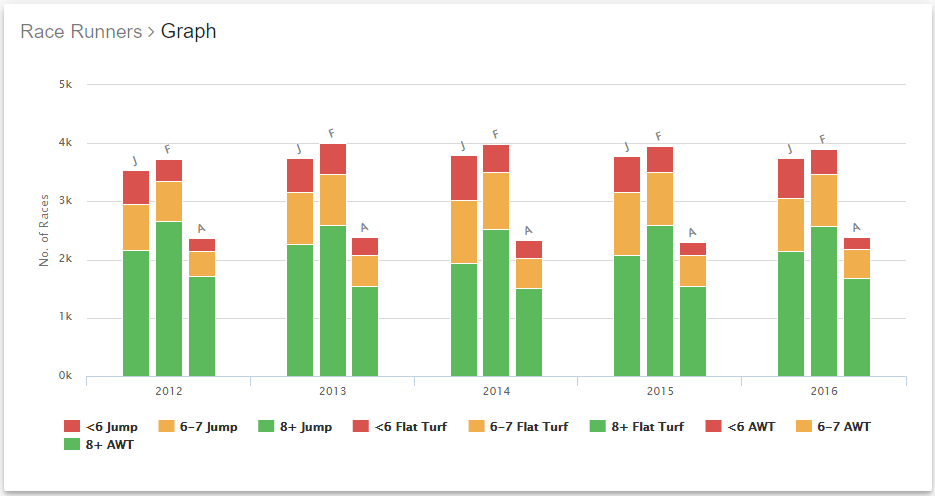
Field sizes have been a major concern for British racing over the past few years with a declining average field size caused by the financial crisis. 2016 was a very good year in this regard. The average field size crept up to 8.93 across all codes compared to 8.77 the year previous. It still has some way to go to reach 9.35 which was recorded in 2012 but it is positive progress nonetheless. National Hunt racing has suffered the most from a drop in average field sizes but it recorded a large rise in 2016, up to 8.53 which is pleasing to see.
Prize money, or the lack of, has been a hot topic in British racing in recent years. The BHA does not offer statistics for each class of racing which may have been more insightful over a mean and median average across all grades of racing. Prize money has increased modestly across all codes since 2012 with AW racing seeing the largest rise from a mean average of £4,157.39 in 2012 to today’s figure of £7,418.12. This may be largely in part to the introduction of the AW champs but has clearly increased the attractiveness of the code. Flat turf recorded the highest mean average prize money but has been undoubtedly effected by the huge increase in prize money at the very top.
One of the most interesting stats from a horse racing tips perspective is the number of races with odds on favourites. There is a significant difference between codes so pay attention if you like your odds on shots. Flat turf racing has the lowest percentage of races with an odds on shot at 11.26%.
Over jumps, the percentage rises to 17.92% which is the highest it has ever been. This is a highly disappointing figure given field sizes are on the rise again. This figure is even more unsettling given the most competitive jumps racing is held on Saturday afternoons, in direct competition with football. Moreover, the competitive jumps racing on a Saturday (think big handicaps, graded races) masks the true state of jumps racing during the week. With rarely a listed jumps race in sight during the week, the number of odds on favourites could in reality, near one in five. This, it has to be said, is a horrific number. It’s unattractive to the punter and bookmaker and risks leaving jumps racing behind.
On a more positive note, AW racing saw another big decline to 13.22% in 2016, down from 16.87% in 2014. The introduction of the AW championships may be making a positive impact on the code with more trainers targeting AW races.
Another betting stat of interest is the average starting price (SP) of favourites under each code. Favourites on the flat turf had the highest SP at 3.38 whilst jumps had the lowest SP at 3.07 which is logical given jumps racing had the highest number of odds on favourites. AW racing recorded an SP average of 3.13, up from 2.9 in 2014.
Overall, 2016 was a positive year for British horse racing. The sport continues to recover from the impact of the financial crisis which made a delayed and hard impact to the sport in 2012. Since then, average field sizes have continued to increase and attendances at British racecourses have remained strong. Horse racing remains an extremely attractive spectator sport and continues to move towards the heights seen in 2008.
All-weather racing saw a real growth in competitiveness and prizemoney in 2016 as it establishes itself as a core part of British racing. Flat turf remains the most competitive code from a betting perspective and the average field size continues to remain strong.
Jumps racing remains of significant concern going forward. There are real questions as to the competitiveness of the racing with a very high proportion of odds on favourites and weak prizemoney. Without the breeding industry to support it, jumps racing relies on the goodwill of owners and its attractiveness as a betting product. Stagnating prizemoney below class two level poses a serious risk to its long term viability.
2017 will be another big year British racing and jumps racing in particular. It must rectify its competitiveness at grassroots level or risks being left behind by its counterparts.
Data taken from: https://brenda.britishhorseracing.com/dashing/